

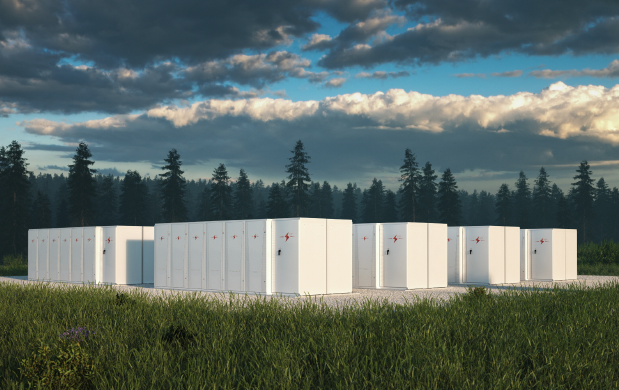
Energy Storage
Sep 2022 | 15 Minutes
Sep 2022 | 15 Minutes
Industry experts, environmental advocates, and policymakers agree on the compounding effects of each misguided industrial attempt and inadequate policies on reaching net-zero carbon goals by 2030. We need coordinated efforts and actions to realize our set targets to decarbonize the economy. Changes must occur across technology sectors and industries, policies, investments in renewing legacy infrastructure, and microeconomic industrial activities.
While existing plans outline significant investments in renewable energy sources such as solar, wind, and related energy storage technologies to reach decarbonization goals, the interdependency between industrial supply chains, industries, and technologies creates ripple effects across markets, sustainability efforts, and practices. In the energy storage sector, key sectors that influence the technology evolution include electric vehicles (EV), smart grid, renewables, mining, and e-waste recycling – to name the least.
International Energy Association (IEA)1 has created a complete list of mineral requirements for clean energy transitions. EV batteries and energy storage manufacturing rely on a steady supply of minerals such as copper, cobalt, nickel, lithium, aluminum, and rare earth elements (REEs). The demand for these metals is likely to grow significantly as the demand for EVs and grid applications continue to rise. The demand for lithium alone is estimated to be around 2.2 million tonnes by 20302, fueling industry and governments’ interest worldwide in the mining sector. The environmental footprint from mining and refining minerals is projected to be much higher than fossil fuels. The IEA suggests that it may lead to a “shift from a fuel-intensive to a material-intensive energy system”i. Considering that it is still more expensive to recycle batteries than to extract and refine minerals, there are still significant technical challenges to solve before achieving a circular economy.
This study utilizes patent and market data to illustrate the progression of innovation and commercial activities in the energy storage sector. It links the supply chain across various segments of the energy storage sector. This report further discusses emerging technology trends, the maturity of technical advancements, and mobile and stationary applications in transportation and energy grids. The report also identifies major organizations with strategic positioning in the market, supply chain risks, opportunities, and new growth segments.
This study identifies and discusses the evolution of battery and energy technologies under three broad categories: (a) electrochemical, (b) electrical and (c) chemical energy storage. Examples of thermal energy storage and mechanical energy storage are outside the scope of this study. Among the electrochemical energy storage, the technologies covered include lithium-ion (Li-ion), nickel-metal hydride (NiMH), solid-state and other metal-ion batteries. Electrochemical energy storage includes aluminum-air, zinc-air, and iron-air batteries, fuel cells, and redox flow batteries. This study also includes hydrogen fuel cells and hydrogen as chemical storage. Chemical energy storage also includes biofuels and power-to-gas. Lastly, electrical energy storage includes supercapacitor, ultracapacitor and superconducting magnetic energy storage types.

The overall patenting trend is rising, with the majority growth in patent filings observed in China. The most number of patents are filed in Li-ion battery technologies. Though a continuous overall growth is observed in this category, the majority of filings are emerging from China in recent times, indicating China’s innovation economy and growing investments in this sector by Chinese firms. Top filers include Chinese battery manufacturers (CATL, BYD, Gotion High-tech (formerly known as Hefei Guoxuan High Tech, Volkswagen majority stakeholder since 2021), SVOLT (spin-off from Great Wall Motors), Tianjin Lishen Battery, COSMX (also known as Zhuhai CosMX Battery)), other Asian battery manufacturers (LG Chem, Samsung SDI, TDK Corp, Panasonic, GS Yuasa, SK Innovation), automobile manufacturers and industry conglomerates (such as Toyota, Bosch, Hitachi, Mitsubishi, Nissan and General Motors) and Chinese universities and other state-owned entities (Central South University, Beijing University of Technology, Harbi University of Science and Technology, Shaanxi University of Science and Technology and State Grid of China).
Technical challenges in the battery sector have led to emerging chemistries bringing a shift in the market choices. Companies like Tesla are opting for LFP batteries over traditional NMC and NCA batteries for lower costs and improved safety. Though the use of less expensive iron and phosphorus in cathode chemistries make LFPs cheaper than nickel- and cobalt-based chemistries, LFPs have comparatively lower energy density. Low energy density impacts the range of EVs and has been a major technical challenge for LFP batteries in their widescale adoption. However, since BYD’s introduction of a new design in LFPs, significant uptake has been seen in the EV sector.
Price movements have recently also been impacted by the supply chain issues due to rising demand, and that can be seen in a reduced price drop as was anticipated. Chinese producers have noticeably raised LFP prices by 10-20% in recent times.Industry forecasts average battery pack prices to be below $100/kWh by 2024, enabling EV automakers to compete in the market through pricing strategies as opposed to subsidies.
Currently, Asia dominates manufacturing in the energy storage sector owing to Japan, China and South Korea catering to the EV battery segment (valued at USD 12.70 billion in 2020)3. The top 10 market leaders control 95% of the market share in the EV sector, with CATL, LG Energy (owned by LG Chem) and Panasonic catering to 69% of the market.
China reportedly produces more than 90% of the world’s LFP batteries4. LFP had a share of 40.34% in 2021 in the energy storage segment due to the growth in the adoption by both EVs and stationery applications5. However, when looking at the constituents of cells, key battery minerals include cobalt, nickel and lithium, out of which cobalt, being expensive (and its use in NMC), accounts for 48.74% in terms of revenue sharexvi.
Patenting trends indicate China is outpacing the US in the number of patent filings originating from its jurisdiction in most energy storage categories. The lead is the greatest in Li-ion battery technologies. Additionally, in a few energy storage categories, patent filings originating from Japan (JP) and the Republic of Korea (KR) are more than in the US as well. From the market share front, NMC dominates the market share with 70%, while LFP is gaining strength in the grid storage as well as EV segment6. Analysts predict LFP will become the leading chemistry for grid batteries by 2030, capturing 30 percent of an increasingly diversified market.
Recent developments in Canada suggest a positive outlook for creating infrastructure and an ecosystem for innovation and growth in this sector. Investments in the region are flowing from multinationals General Motors as well as industry upstarts like StormVolt. Energy storage manufacturing giant LG and automaker Stellantis recently announced a battery plant in Windsor (ON).
Government funding is also flowing to support Canadian companies. In a recent example, the Quebec government provided $18 million in funds to Lithion Recycling operating in battery recycling. The mining industry also contributes significantly to Canada’s GDP. Canada is home to numerous mining companies that explore minerals in Canada and worldwide. In 2020, approximately 1,187 Canadian mining companies had mining and exploration assets valued at C$273.4 billion. In addition, Canadian companies had mining and exploration assets worth C$188 billion located in 97 countries, including Africa, Australasia, Europe, South America and the United States.”7
Other promising technologies include Hydrogen fuel cells. The global Hydrogen fuel cells market size is expected to grow from USD 4 billion to USD 25 billion, with a CAGR of 33.4% during 2022-20288. Key patent filers include Toyota, Panasonic and Wuhan Grove Hydrogen Automobile. Canadian company Ballard Power Systems is a prominent manufacturer of PEM fuel cells, with a suggested 18% market share. The other two prominent manufacturers of hydrogen fuel cells include Plug Power and Toshiba.
With the aim that organizations want to maximize the rent generated from their IP, the most important question for a business to understand is who is profiting from their innovative activities. And to identify the entities that would potentially benefit from their innovation or pose a threat to the organization from maximizing their profits, an in-depth understanding of the positioning of the different types of players throughout the supply chain need to be identified and understood.
By definition, value chain refers to the various value-adding business activities and/or processes that are required to deliver products and/or services. IAC’s landscape studies undertake a sector-level value chain analysis to organize patent and market trends and examine the competition. Therefore, examining these value chains and how businesses can extract meaningful information from such illustrations and analyses may be worthwhile.
Value chain analysis is a powerful tool for understanding competition and market structures. Competition is not merely the organizations competing with one another in a specific market or technology domain. Competition should be understood from the perspective of a diverse set of players throughout the supply chain, including innovators, imitators, complementary asset providers, suppliers and even customers. Value chain analysis, as IAC presents in its landscape studies, helps in determining the incumbency, controlling positions, and other interdependencies across the sector.
Incumbency: While businesses can understand from here that the organizations in the incumbent position generally have the resources to “finance innovation, absorb risk and earn monopoly rights” iii, they may also bring opportunities in appropriating innovation or creating mutual value across the supply chain. At the same time, incumbency may also pose a risk to the survival of other players in the market.
Interdependencies: Interdependencies open a gateway for supply chain risks and issues, as well as opportunities for organizations to identify new market needs to fulfil. A common outlook for SMEs is to understand the complementarity nature of their products and services to the offerings of well-established or controlling players or to fit in the essential needs of the customers.
Technological regime: Patents are only one form of IP protection strategy to create barriers for other firms from appropriating innovation and entering the market. Patenting strategies inform about organizations’ protection at the country level, who is dominant, and technologies and/or applications gathering momentum, among other observations. Patents can also be an indication of investment, by and large.
Innovation and competitive market structures are relational. No simple definition can summarize the implications of one or the other as various factors come into play. However, from an in-depth study of value chains and patenting trends, organizations can formulate better-informed business strategies such as market entry strategies, IP protection strategies, alliances and partnerships need, investment and R&D strategies, and other growth strategies.
Different types of energy storage – broadly grouped as electrochemical, electrical, chemical, thermal and mechanical energy storage are depicted in Figure I: Energy Storage Types. The energy storage or battery attributes – such as rechargeability, energy density, power density, shelf life, safety, form factor, cost, and flexibility – determine their suitability for different application areas.
Electrochemical Energy Storage Value Chain illustrates the value chain of the energy storage sector, identifying activities across different industries and sub-sectors from raw materials supply to cell components, manufacturing and assembly and accessories, and reuse and recycling. Note that though the landscape study provides a complete picture of the value chain, the focus of the patenting analysis has remained on the central components of battery manufacturing and management systems.
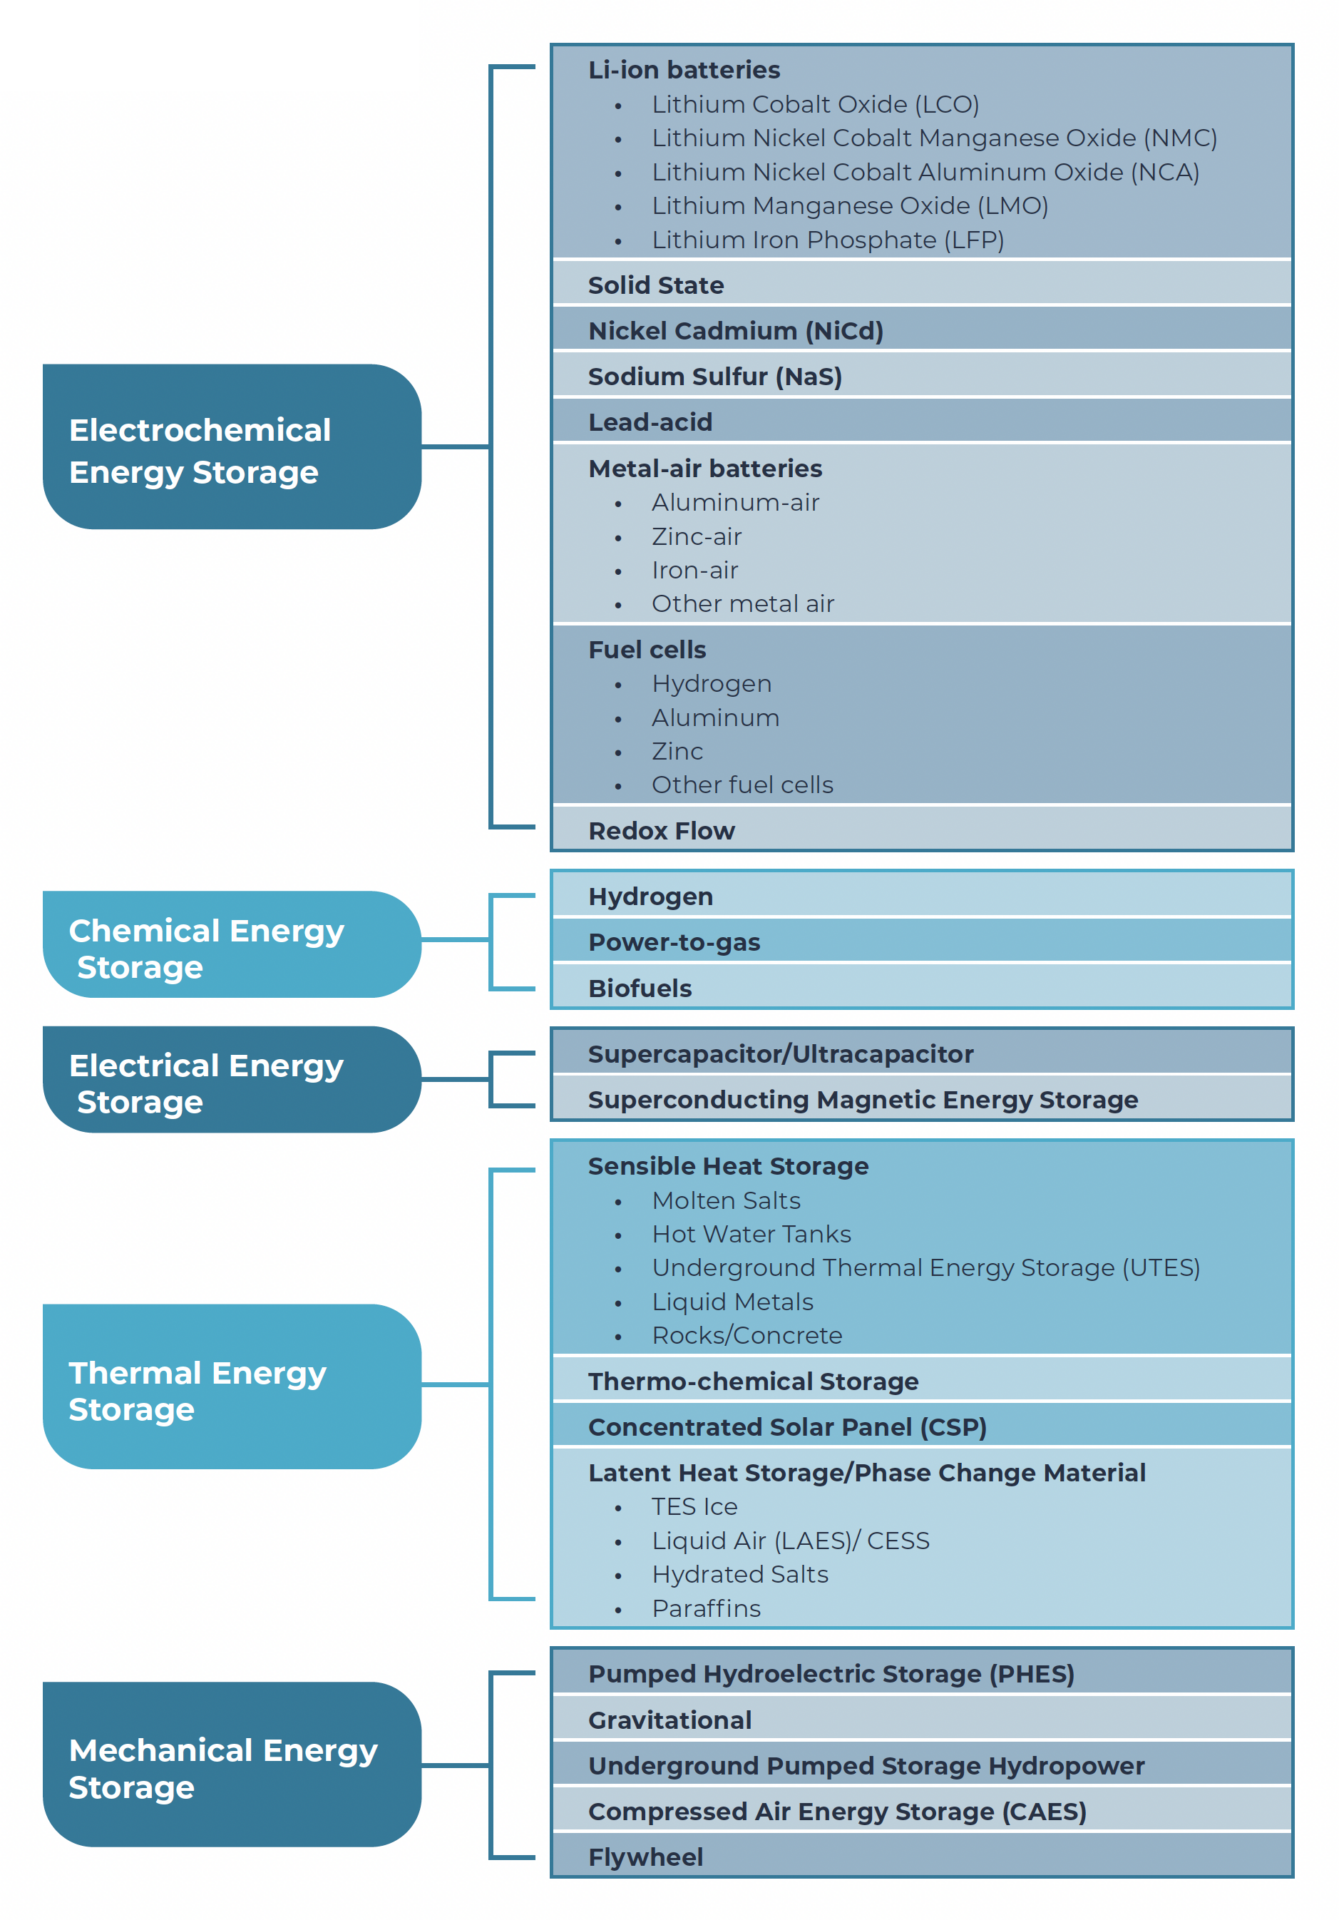
Figure I: Energy Storage Types

Figure 2: Electrochemical Energy Storage Value Chain
As understood through the supply chain of energy storage, the growth in the market strongly connects with the issues and technical solutions across the value chain. On the supply side, the mining industry plays a central role in sourcing raw materials needed to fulfil the growth in the EV market. The mining industry contributes significantly to Canada’s gross domestic product (GDP). The Mining Association of Canada reported that the mining industry contributed C$107 billion (5% of Canada’s GDP) to the GDP10. On the other end, the end-of-life options for a battery, such as battery reuse or repurposing (“second life”), cater to certain segments of energy storage, particularly lower-powered stationary energy storage. However, continuous improvement in battery design and reduction in costs of new batteries lowers the lucrative effect of reusing and refurbishing batteries. Recovery of materials through recycling is also another option for sourcing raw materials. Here again, recycling techniques have seen only a slight improvement over the years, making recycling still a costly affair compared to mined resources.
From the manufacturing end, emphasis is on improving the battery design to mitigate sourcing risks and reliance on less abundant and/ or hazardous minerals such as cobalt. Lithium-ion batteries have particularly seen a huge pool of investments in solving technical challenges in this area. Recent chemistries have focused on cathode’s active materials to develop designs utilizing lesser nickel and cobalt. Over the years, the use of battery chemistries has moved on from lithium cobalt oxide (LCO) and lithium manganese oxide (LMO) (both of which were predominantly used in consumer electronics at the time) to nickel manganese cobalt (NMC), lithium iron phosphate (LFP) and, more recently, lithium nickel cobalt aluminum oxide (NCA). The detailed landscape report contains a more detailed summary of the technical advancements in battery design.
Rapid technological advancements can also be seen in battery management systems managing rechargeable or secondary batteries or battery packs. Some of the other electrochemical energy storage types covered in the landscape report are metal-air batteries, hydrogen fuel cells and redox flow batteries.
The detailed landscape report also discusses chemical energy storage like hydrogen, biofuels and power-to-gas and electrical energy storage such as supercapacitors, ultracapacitors and superconducting magnetic energy storage (SMES).

The energy storage sector has seen significant growth in the last few years, especially with the traction gained from the EV market investments. Several market reports11 12 13 14 15 16 have compiled statistics on key energy storage technologies in the mobile and stationary energy storage sector.
Estimated market growth: By 2030, stationary and transportation energy storage combined markets are estimated to grow to 2.5–4.2 terawatt-hours (TWh) annually, approximately three to five times the current 800-gigawatt-hour (GWh) market.
Out of which, EVs have gained greater acceptance and have transitioned mobility to the largest single demand for energy storage, representing approximately five to ten times greater usage by energy capacity than stationary energy storage.
Mobility energy storage: Reports indicate mobility storage demands to grow from 0.8 to 3.0 TWh by 2030, with the demand for light-duty EVs dominating near-term markets. Sale of EVs nearly tripled between 2020 and 2021 alone, accounting for 7% of the global car sales in 2021. By 2040, a sale of 45 million EVs with an estimate of 323 million EVs on the road is forecasted. China and Europe are expected to be the largest medium-term mobility storage market. The passenger EV segment and commercial EV segment are projected to grow with a CAGR of 29.9% and 30.3%, constituting 2.3 TWh and .57 TWh, respectively. Cumulative residential and public charging points are projected to grow to 32.5 million and 5.4 million outlets by 2030, with an investment value of US$2.7 billion and US$3.3 billion, respectively.
Stationary energy storage: By 2031, analysts project the largest markets for stationary energy storage include North America (41.1 GWh), China (32.6 GWh), and Europe at 89 GWh (with a 97% growth expected to be in 2022 alone, deploying 3.3 GWh). Excluding China, Japan (2.3 GWh) and South Korea (1.2 GWh) make up a large part of the rest of the Asian market. Much of the expansive growth is 4-hour-duration hybrid configurations coupled to utilities, commercial and industrial (C&I), and residential renewables (generally photovoltaics [PV]).
Global demand in the Li-ion batteries and energy storage market alone is projected to grow exponentially from 213 GWh in 2019 to 3,100 GWh by 2030, with EV market constituting ~70% and a CAGR of 29.9% and 30.3% between 2019 and 2030 for passenger transportation and commercial vehicles respectively. Industry experts project that the growth in EV demand due to technological advancements in batteries, improvement and scaling of manufacturing processes, and policy shifts will impact the economics of EV, making them eventually affordable and comparable to internal combustion engine vehicles.
However, a look at the supply side of the materials and the “unavoidable scale of materials” demand is likely to dampen the anticipated cost reductions due to escalating prices of the energy transition minerals. For example, commodity materials comprise 60-70% cost of manufacturing a battery at a cell level. In 2021, there was only a 6% decline in battery prices, which is lower than the trend observed in the previous years due to the rise in commodity material prices. IEA suggests that “an energy plan more ambitious than implied by the 2015 Paris Agreement, but one that remains far short of eliminating the use of fossil fuels, would increase demand for minerals such as lithium, graphite, nickel, and cobalt by 4,200%, 2,500%, 1,900% and 700%, respectively, by 2040”17.
A few interesting statistics displaying the trend include:
It should also be noted that the energy storage market also influences renewables sector, such that the rise in commodity prices can be seen impacting the cost to build wind and solar systems.
A plausible solution to manage the rising fear in the industry related to the hike in commodity materials demand and cost “reversing the long-run costs declines” lies in the reuse and recycling of the batteries. The ideal is described as a circular economy achieving nearly complete reuse of materials from discarded hardware. However, the maturity of the technologies in this segment has not yet reached a level to have economy-wide impacts.
Additionally, as the average time to set up a mine is close to 16 years, mining alone cannot completely fulfill the growing demand for minerals. Given this, the industry will have to seek other sources of minerals to meet global demand.
Regulatory targets around the globe will push industries, particularly transportation and utilities, to scale manufacturing and adoption of cleaner energy storage solutions. For effective policies pushing for an energy transition towards sustainability, a much deeper understanding of the workings of the supply chain is needed. In other words, understanding linkages between policies and their implication on the innovation and growth in the industry, identifying possible bottlenecks within the supply chain, and identifying inadvertent consequences of the sustainable efforts in one area leading to environmental pressure on other areas.
The presence of global supply chains in this sector indicates that it isn’t just regional policies that influence local decision-making. Trade-offs and consequences resulting from policies of different regions and at a world forum, along with supply chain effects, can help create more realistic plans by policymakers.
China boasts 70% of the world’s cell production capacity and has been dominating the global market for the last few years. “The growth seen over the last few years in electric vehicle (EV) adoption is expected to continue as central and local government incentives for consumers remain in place in many major world markets and as manufacturers increase the size of manufacturing platforms.”
A quick comparison between the battery markets on a regional basis indicates that “battery pack prices were cheapest in China, at $111/kWh, while packs in the US and Europe cost 40% and 60% higher, respectively.” The battery pack prices could indicate “the relative immaturity of these markets, the diverse range of applications and, for the higher end of the range, low volume and bespoke orders.”
Global supply chains and interdependencies between countries suggest that political events can trigger worldwide economic impacts/implications. More recently, the Ukraine event has caused nickel and lithium carbonate prices to surge, impacting energy storage supply chain markets. The European Commission also declared stricter guidelines and policies to reduce any dependency on Russia for fossil fuels before 2030, accelerating the pace of change in this sector.
Cobalt, Nickel and Lithium are the three key minerals needed for batteries. The world’s major producers of these minerals would become central in influencing supply chains and costs margins/transaction costs. Changes in political situations in major mineral-producing nations can fluctuate raw material supplies and prices.
The detailed landscape report provides insights and trends using time-series illustrations and quality indices to analyze patent data, supplemented by market information.
1 International Energy Association report, IEA (2021), The Role of Critical Minerals in Clean Energy Transitions, IEA, Paris https://www.iea.org/reports/therole-of-critical-minerals-in-clean-energy-transitions
2 Kaunda, R. B. (2020). Potential environmental impacts of lithium mining. Journal of Energy & Natural Resources Law, 38(3), 237-244.
4 Energy Storage Grand Challenge Energy Storage Market Report
5 https://www.reportlinker.com/p06287394/Lithium-Ion-Battery-Metals-Market-A-Global-and-Regional-Analysis-Focus-on-Constituent-Metal-Cell-Chemistry-End-Use-Application-and-Region-Analysis-and-Forecast-2031.html?utm_source=GNW
6 Wood Mackenzie report Can LFP technology retain its battery market share? Report | Wood Mackenzie
7 Government of Canada Minerals and the economy (canada.ca)
8 https://reports.valuates.com/market-reports/QYRE-Auto-26E44/global-hydrogen-fuel-cells
9 Teece, 2006
10 The mining association of Canada New Report on the State of Canada’s Mining Industry Highlights Opportunities to Lead as Supplier of Materials Essential to Low-Carbon Transition – The Mining Association of Canada
11 US Department of Energy, Dec 2020, Energy Storage Grand Challenge: Energy Storage Market Report, https://www.energy.gov/sites/default/ files/2020/12/f81/Energy%20Storage%20Market%20Report%202020_0.pdf
12 U.S. Energy Information Administration, Jul 2020, Battery Storage in the United States: An Update on Market Trends, https://www.eia.gov/analysis/ studies/electricity/batterystorage/pdf/battery_storage.pdf
13 National Renewable Energy Laboratory (NREL, US), Jun 2019, Cost Projections for Utility-Scale Battery Storage, https://www.nrel.gov/docs/ fy19osti/73222.pdf
14 Roland Berger, Apr 2022, A secure supply of raw and refined materials for batteries and an optimized supply-chain set-up are vital to the electric vehicle business model, https://www.rolandberger.com/en/Insights/Publications/Digging-deeper-How-to-manage-supply-chain-risk-for-lithium-ion-batteries.html
15 Advanced Research Projects Agency – Energy (U.S. Department of Energy), Apr 2020, Why Long-Duration Energy Storage Matters, https://arpa-e. energy.gov/news-and-media/blog-posts/why-long-duration-energy-storage-matters
16 Wood Mackenzie, Sep 21, Electric Vehicle Research, https://www.woodmac.com/our-expertise/capabilities/electric-vehicles/
17 Mills, Mark P. Jun 2022. The Hard Math of Minerals, Issues in Science and Technology (January 27, 2022).
18 BloombergNEF, Nov 2021, Battery Pack Prices Fall to an Average of $132/kWh, But Rising Commodity Prices Start to Bite, https://about.bnef.com/ blog/battery-pack-prices-fall-to-an-average-of-132-kwh-but-rising-commodity-prices-start-to-bite/
Sources for market size: [1] The Insight Partners, [2] Research and Markets, [3] Research and Markets, [4] Facts and Factors and [5] Research and Markets
Disclaimer: The content of this document may have been derived from information from third-party databases, the accuracy of which cannot be guaranteed. IAC hereby disclaims all warranties, expressed or implied, including warranties of accuracy, completeness, correctness, adequacy, merchantability and/or fitness of this document. Nothing in this document shall constitute technical, financial, professional, or legal advice or any other type of advice, or be relied upon as such. Under no circumstances shall IAC be liable for any direct, indirect, incidental, special, or consequential damages that result from use of or the inability to use this document.
See how our IP expertise can support your business.